My colleague and I have published a new article in Harm
Reduction Journal entitled “Joint Smoking-Vaping Prevalence Rates Among
American Youth and Young Adults 2011-2022.”
This post is dedicated to U.S. federal government officials, especially
at the FDA Center for Tobacco Products and the CDC Office of Smoking and
Health. Despite having smoking and
vaping data from federal surveys for the past thirteen years, those officials
have never published joint prevalence rates.
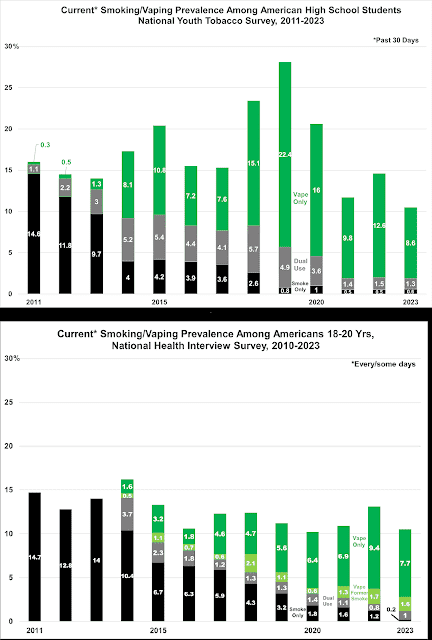
I present two charts on the left, but please read the full
article for more information (here). The charts speak for themselves, so I won’t bore
you with unnecessary details. The first
shows that smoking among high schoolers has basically disappeared at the same
time that vaping skyrocketed up…then down.
Note that the vertical axis is the same for both charts, topping out at
30%. So while the high school vaping
rate was very volatile with sharp increases and declines, vaping in young adults age 18-20 was much more
stable. But
the smoking rate went down and stayed there, suggesting that these general
trends are likely to continue. Which
means that in 25 to 30 years, smoking-related diseases will disappear too.
My final chart, below, shows quit ratios (QRs) for all adult
age groups in our study. QRs, which are
the prevalence of former smoking divided by the prevalence of ever smoking X
100, are a well-established and meaningful measure of quitting success among a
population. Once again, very little
explanation is needed. Whereas QRs among
the younger age groups were low in 2011, all are above 50% now. Note especially the extraordinary one-year
increase in the QR among emerging young adults, from 53% in 2022 to 73% in 2023.
Nota Bena. Discerning
readers will notice that the figures in this blog contain one more year (i.e.
2023) than our HRJ article. The
reason is that the article was in review for over 12 months, during which time
the 2023 data was released by the CDC.
My colleague and I considered updating the article, but we feared that
it would prompt more months of delay.


